Where travel agents earn, learn and save!
News / World aviation: back to the last century
In 2020 passenger numbers were back to 2003 levels, and RPKs were back to 1999's volume

February 17 - It is no longer news to report that the COVID-19 pandemic has had a massive and devastating impact on the world aviation industry. Nevertheless, looking at various measures of the industry’s scale in 2020 provides historical context. It illustrates how far this growth industry has been set back.
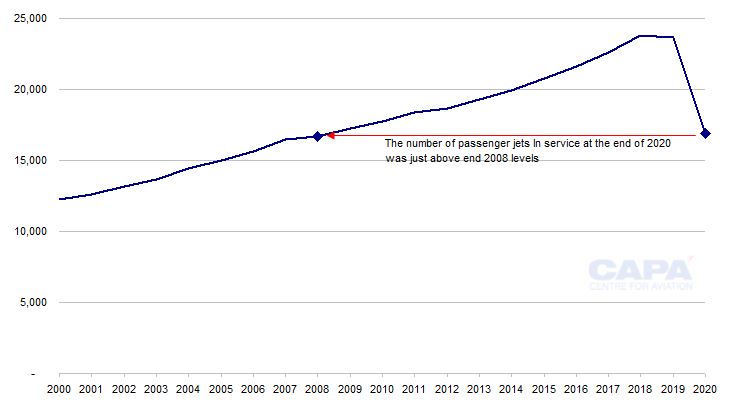
According to data from the CAPA Fleet Database, the number of passenger jet aircraft in service with the world’s airlines at the end of 2020 was back to 2008 levels.
However, this 12-year setback is much less than the impact on traffic. Last year, in 2020, passenger numbers were back to 2003 levels, while RPKs were back to 1999’s volume. Passenger load factor slumped to levels not seen since the 1980s and early 1990s.
Air cargo traffic was less badly affected, losing only five years of growth.
Early 2021 is not yet witnessing any improvement, but aviation’s historic track record of growth was built on its role in economic growth and in connecting the world and its people. As vaccination programmes are rolled out, these factors give cause for optimism that aviation can return to growth.
At the end of 2020, the passenger jet fleet in service was back to 2008 levels
According to the CAPA Fleet Database, the number of passenger jets in service at the end of 2020 was just under 16,700.
This was down by 29% compared with more than 23,600 at the end of 2019 and back to the number in service at the end of 2008, when the world was gripped by the global financial crisis.
The number of passenger jets in service at the end of 2020 was considerably higher than at the lowest point of the pandemic. At the end of Apr-2020, the figure had slumped to just over 9,600, in line with the end of 1996.
The average month-end number in service through 2020 was approximately 15,900, down by 33% year-on-year, and only just above the figure last recorded at the end of 2006.
As a percentage of all passenger jets, the number in service fell from 88.1% at the end of 2019 to just 35.8% at the end of Apr-2020, before ending the year at 61.9%.
Global number of passenger jets* in service: 2000 to 2020**
*Widebodies, narrowbodies and regional jets for passenger use.
**At year end.
Source: CAPA Fleet Database.
Passenger numbers in 2020 were back to 2003 levels
The year end 2020 passenger jet fleet in service wiped out 12 years of growth (the 2020 average wiped out 14 years), but the number of scheduled passengers flown in 2020 removed 17 years of growth.
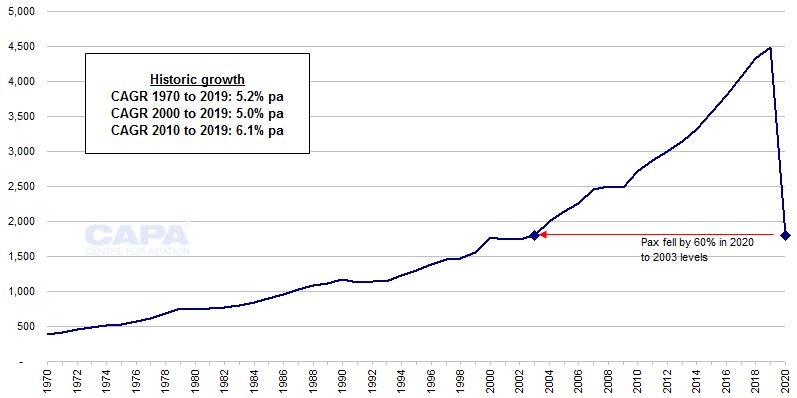
According to ICAO, passenger numbers plummeted by 60% in 2020, to 1.8 billion – a figure last carried by the world’s airlines as long ago as 2003.
Global scheduled passenger numbers (millions): 1970 to 2020
RPKs – like it's 1999
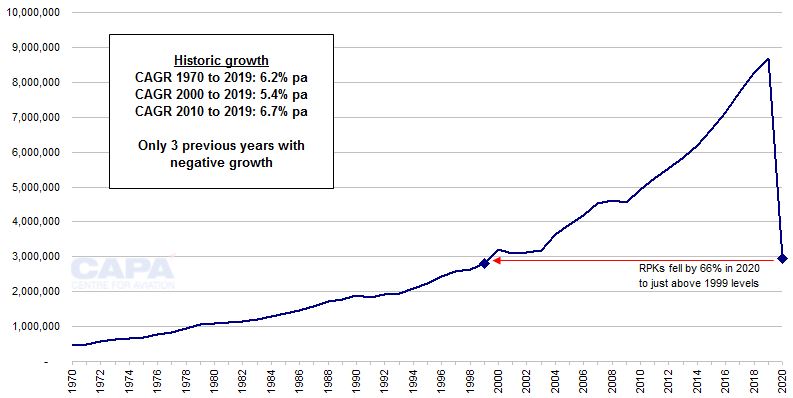
For 2020's level of revenue passenger kilometres (RPKs), it is necessary to go back further still – 21 years, to 1999.
According to IATA, global RPKs were 66% lower in 2020 than in 2019 and back to the volume last recorded in the final year of the 20th century.
The fall in RPKs was bigger than the fall in passenger numbers because long haul traffic was disproportionately hit by the COVID-19 pandemic.
Global scheduled revenue passenger kilometres (RPKs, millions): 1970 to 2020
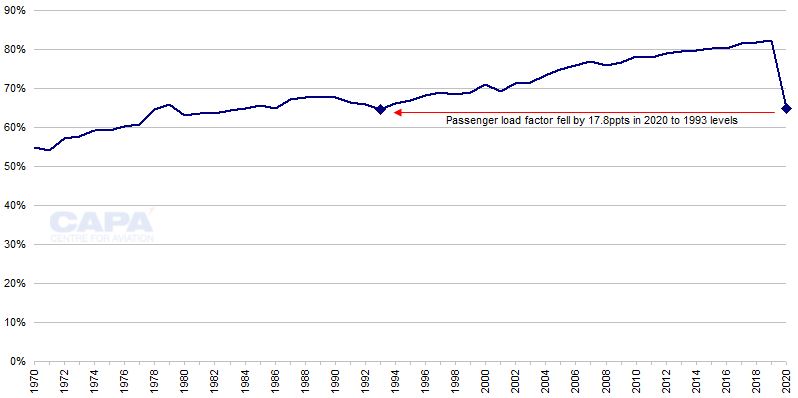
Passenger load factor fell to 1980s/1990s levels
The weaker performance of passenger traffic compared with the number of passenger jet aircraft in service in 2020 reflects a significant collapse in capacity utilisation.
In 2020 passenger load factor fell by 17.8ppts, to 64.8%, reversing a long term improving trend and taking the airline industry back 27 years to its 1993 level (and broadly in line with the load factors of much of the 1980s).
Global passenger load factor (percentage): 1970 to 2020
Aircraft utilization also slumped
Even this big drop in load factor does not full account for the difference between the fall in the number of passenger jets in service (down by 33%) and the fall in RPKs (down by 66%).
Although data are not currently available to illustrate it, the difference points to another significant decline: in the daily utilisation rates of aircraft in service.
Many aircraft have been kept in service, to avoid the costs of decommissioning and possible recommissioning and to maintain flexibility in responding to possible demand recovery, but have only been flown infrequently.
Air cargo traffic fell back only to 2015 volumes…
This analysis emphasises the unprecedented scale of the impact of COVID-19 on airline passenger operations: taking the industry back to 2008 for jets in service, to 2003 for passenger numbers, to 1999 for RPKs, and to 1993 for passenger load factor.
The one relative bright spot for the world’s airlines is the performance of cargo operations during the pandemic.
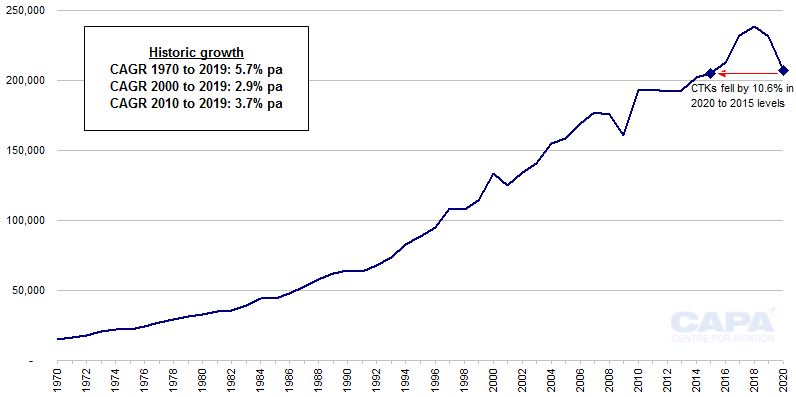
According to IATA, cargo tonne kilometres (CTKs) fell by 10.6% in 2020. This was still a big fall by previous standards of normality, but much less than the impact on passenger traffic. It wiped out only five years of growth, taking CTK levels back to 2015.
…and cargo load factor rose
Moreover, cargo load factor achieved a strong improvement, growing by 7.7ppts to 54.5% in 2020, since cargo capacity fell more rapidly than cargo traffic. The fall in passenger capacity – particularly widebody capacity – removed a significant amount of cargo capacity in passenger aircraft belly space.
It is rare for cargo load factor to rise above 50%. Before 2020, this was last managed in 2010.
Global cargo tonne kilometres (CTKs, millions): 1970 to 2020
Global aviation will return to growth - after losing all of the 21st century's growth
By the most commonly used measure of airline passenger traffic, RPKs, the COVID-19 crisis wiped out all the traffic growth achieved in the 21st century. This was realised through a 66% drop in RPKs – a single-year decline that was previously unthinkable.
Indeed, before COVID, any kind of negative growth in RPKs was very rare. Before 2020, global RPKs had only suffered annual declines three times in history (based on data from ICAO going back to 1929).
These were a 2.6% drop in 1991, a global recessionary year; a 2.9% drop in 2001, the year of the 9/11 attacks; and a 1.0% drop in 2009, during the global financial crisis.
The impact of the pandemic dwarfs these previous crises and will lead to lasting change in the airline industry.
Nevertheless, the historic long term growth in aviation over many decades and the very rarity of annual falls in traffic provide some confidence for the future.
Future air traffic growth may not match historic rates, and it may be volatile as the world adjusts to living with COVID-19, but aviation will return to growth.
More Travel News:
Skyscanner Weekly Travel Insights
WTTC responds to the passing of Arne Sorenson
Transforming Tourism: UNWTO Global Startup Competition Winners Announced
French Saint-Martin’s video: “Can’t help falling in love with Saint-Martin”


